
brand, content and data services.
Eleven services in two areas. Choose by the problem you have today: a brand to build, content to publish without stopping your operation or data nobody uses.
brand and communication. branding, websites, videos
AI avatar videos
We capture photos, video and voice once. After that, you approve the script and receive finished videos every month.
websites
From landing pages to full portals, prototyped in Figma and built in Webflow.
logo and visual identity
Brands designed from hand sketches, with stationery and files ready for registration.
brand strategy
Brand pillars and personality defined before the visuals, to guide every communication decision.
graphic and digital design
Social media, print, events and campaigns with your identity applied with rigor.
illustration and 3D
Illustration and 3D for campaigns, mascots, educational materials and POS displays.
data and product. BI, UX, digital products
dashboards and information design
BI dashboards designed around the questions your managers ask every day.
information design and UX for data course
9+ hours of training so your data team can design better dashboards on its own.
design mentoring for data
Consulting support for your BI team, with diagnostics and documented best practices.
product design
UX research, UX design and UI design for digital products that people actually use.
apps
From discovery to a published app, with a team dedicated to your business.
these services in projects.
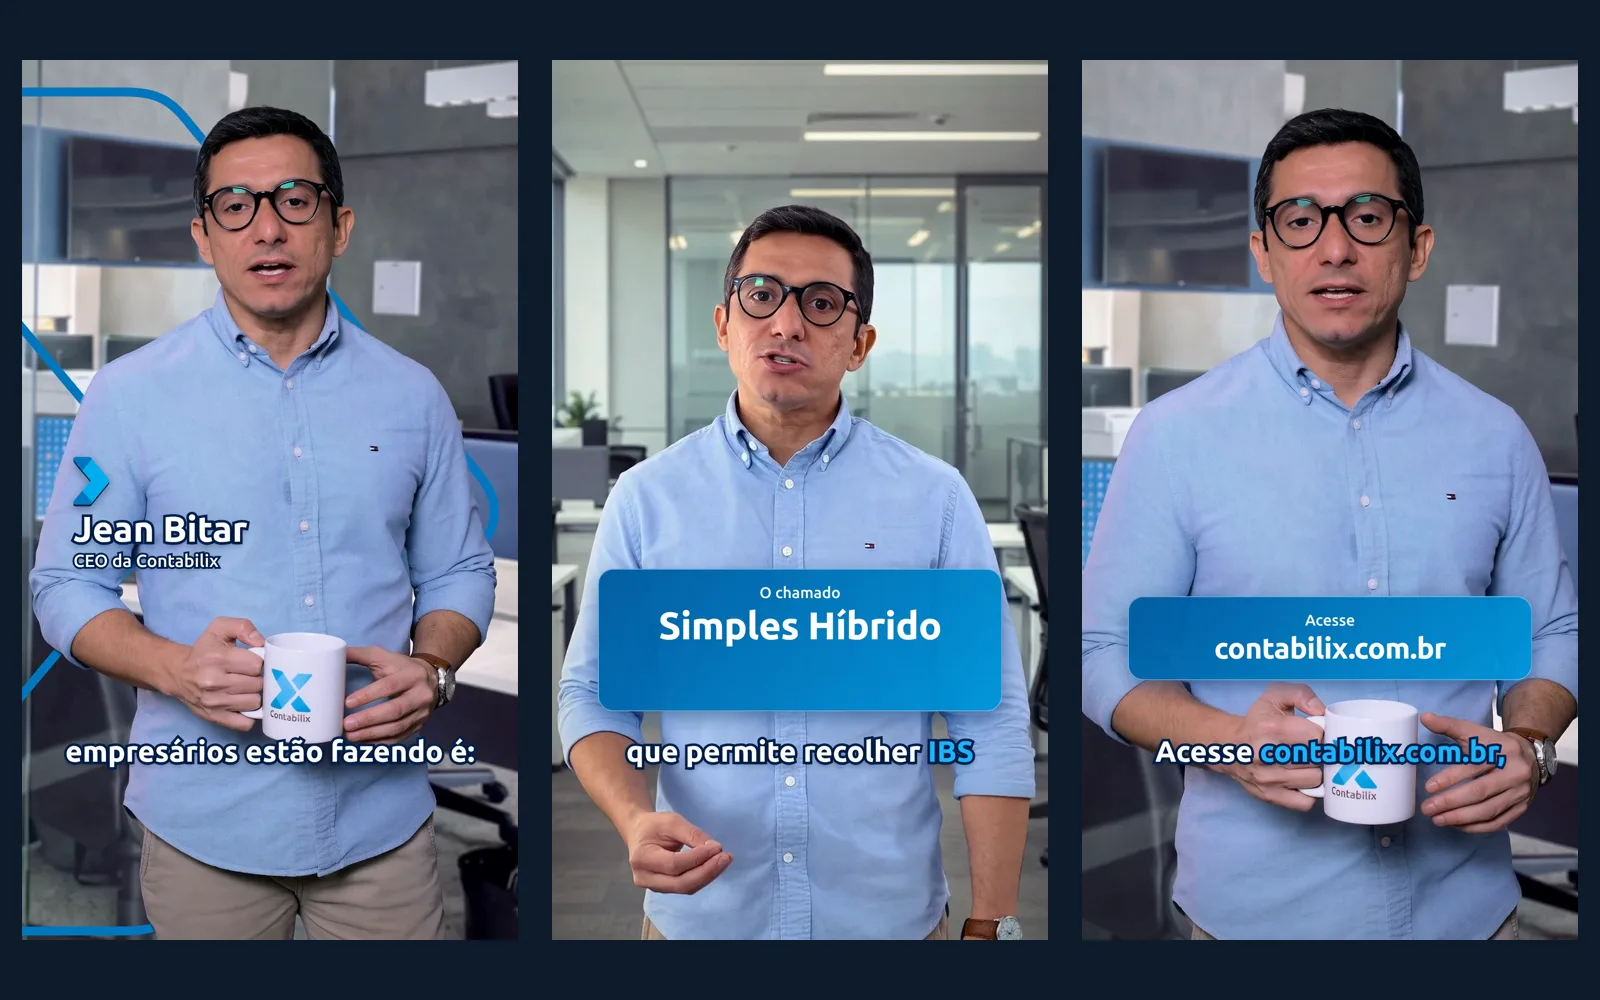
 accounting
Contabilix: CEO videos with an AI avatar, without stopping the office
400 photos, a cloned voice and scenes from the real office to generate videos with no film crew.
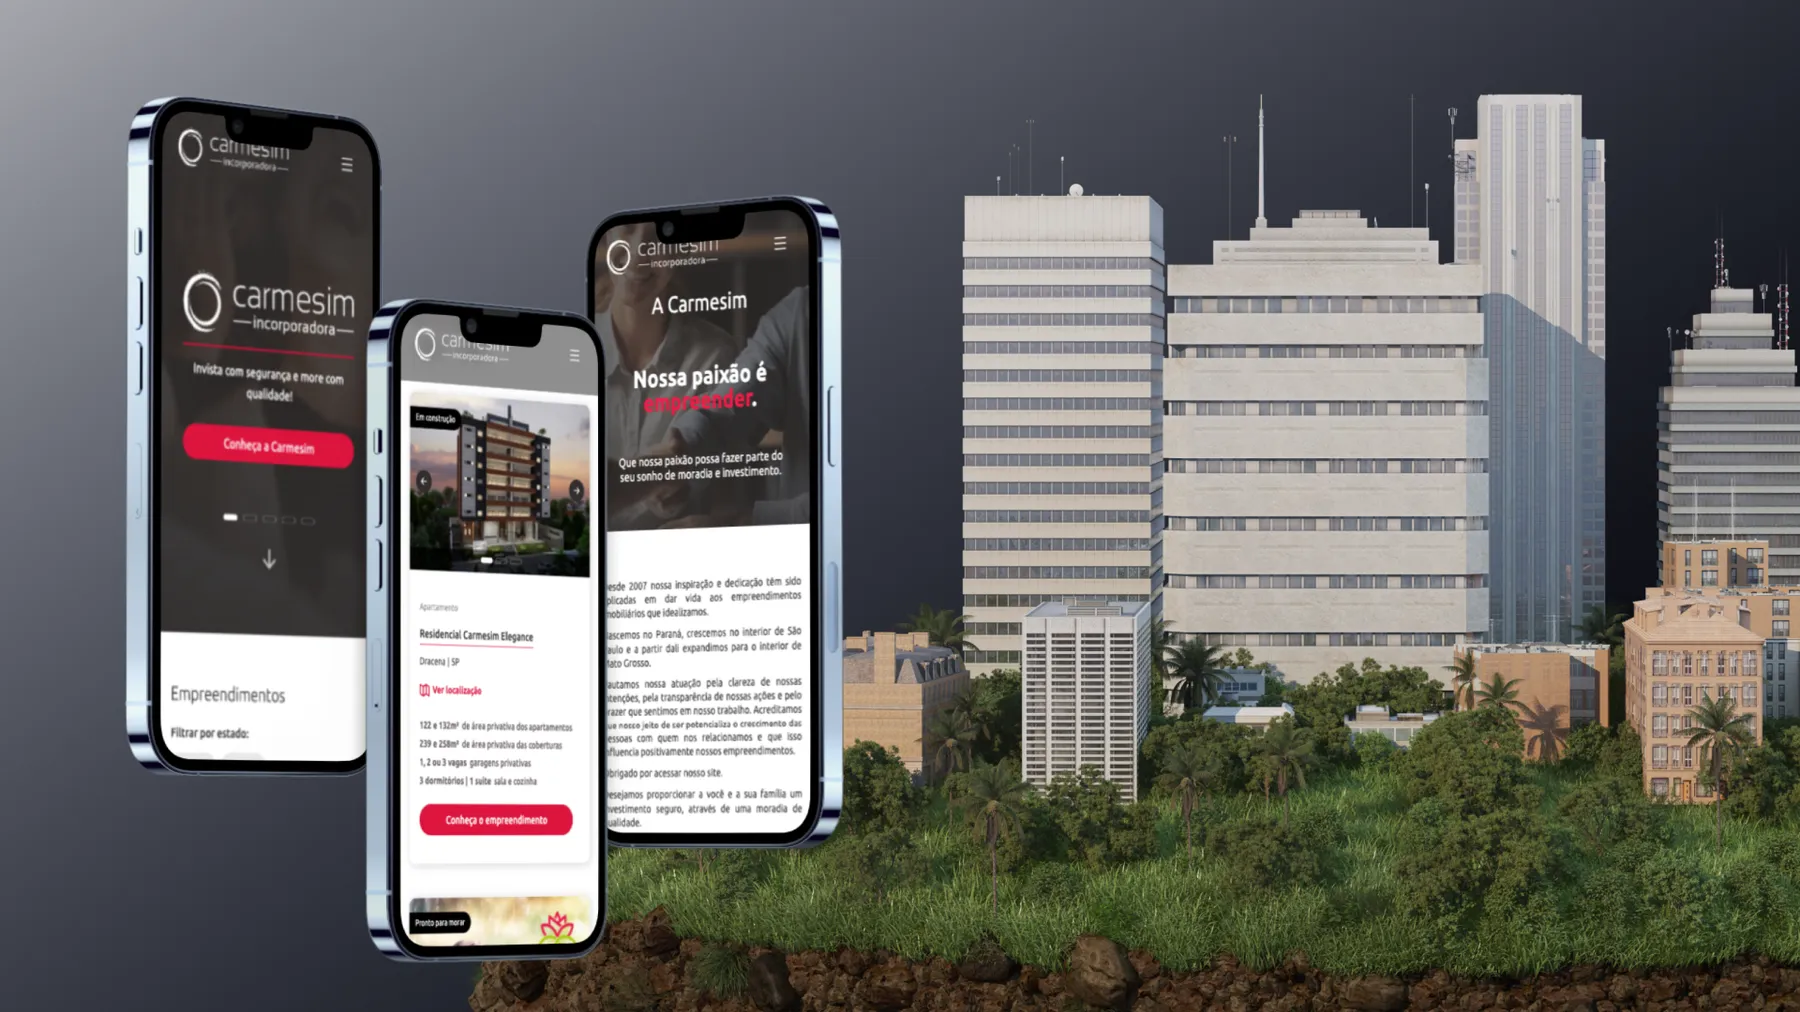
 real estate
Carmesim: new real estate website with 233% more pageviews
New portal for a developer that has been a client since 2013: +233% pageviews right after launch.
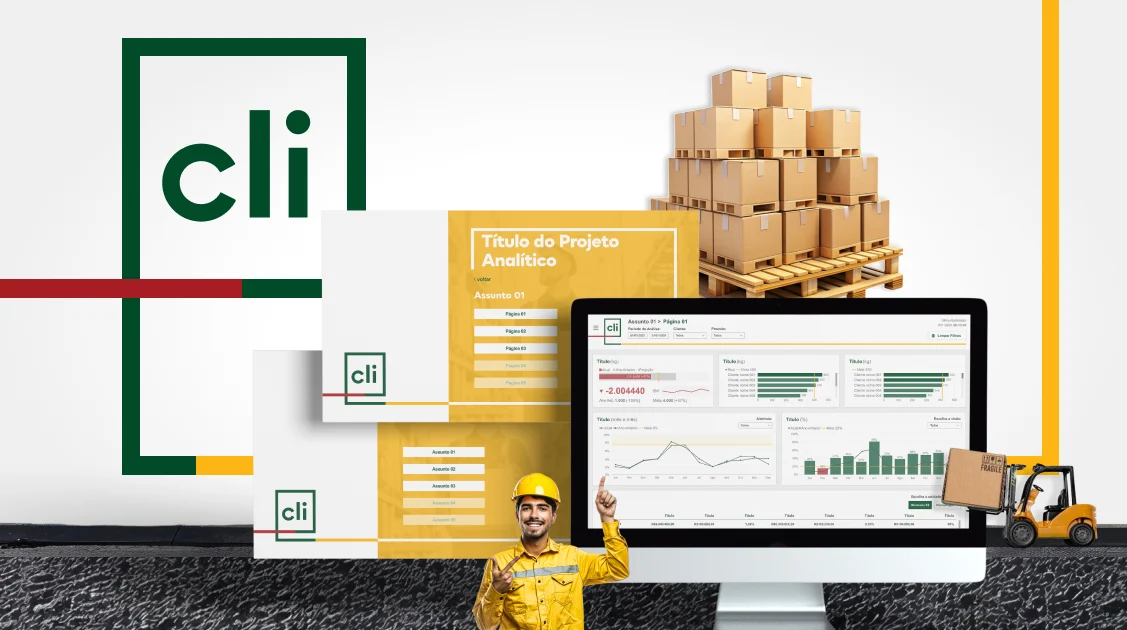
 logistics
CLI: visual standardization in Power BI with its own style guide
Power BI theme and style guide so the data team can scale dashboards that look like the brand.
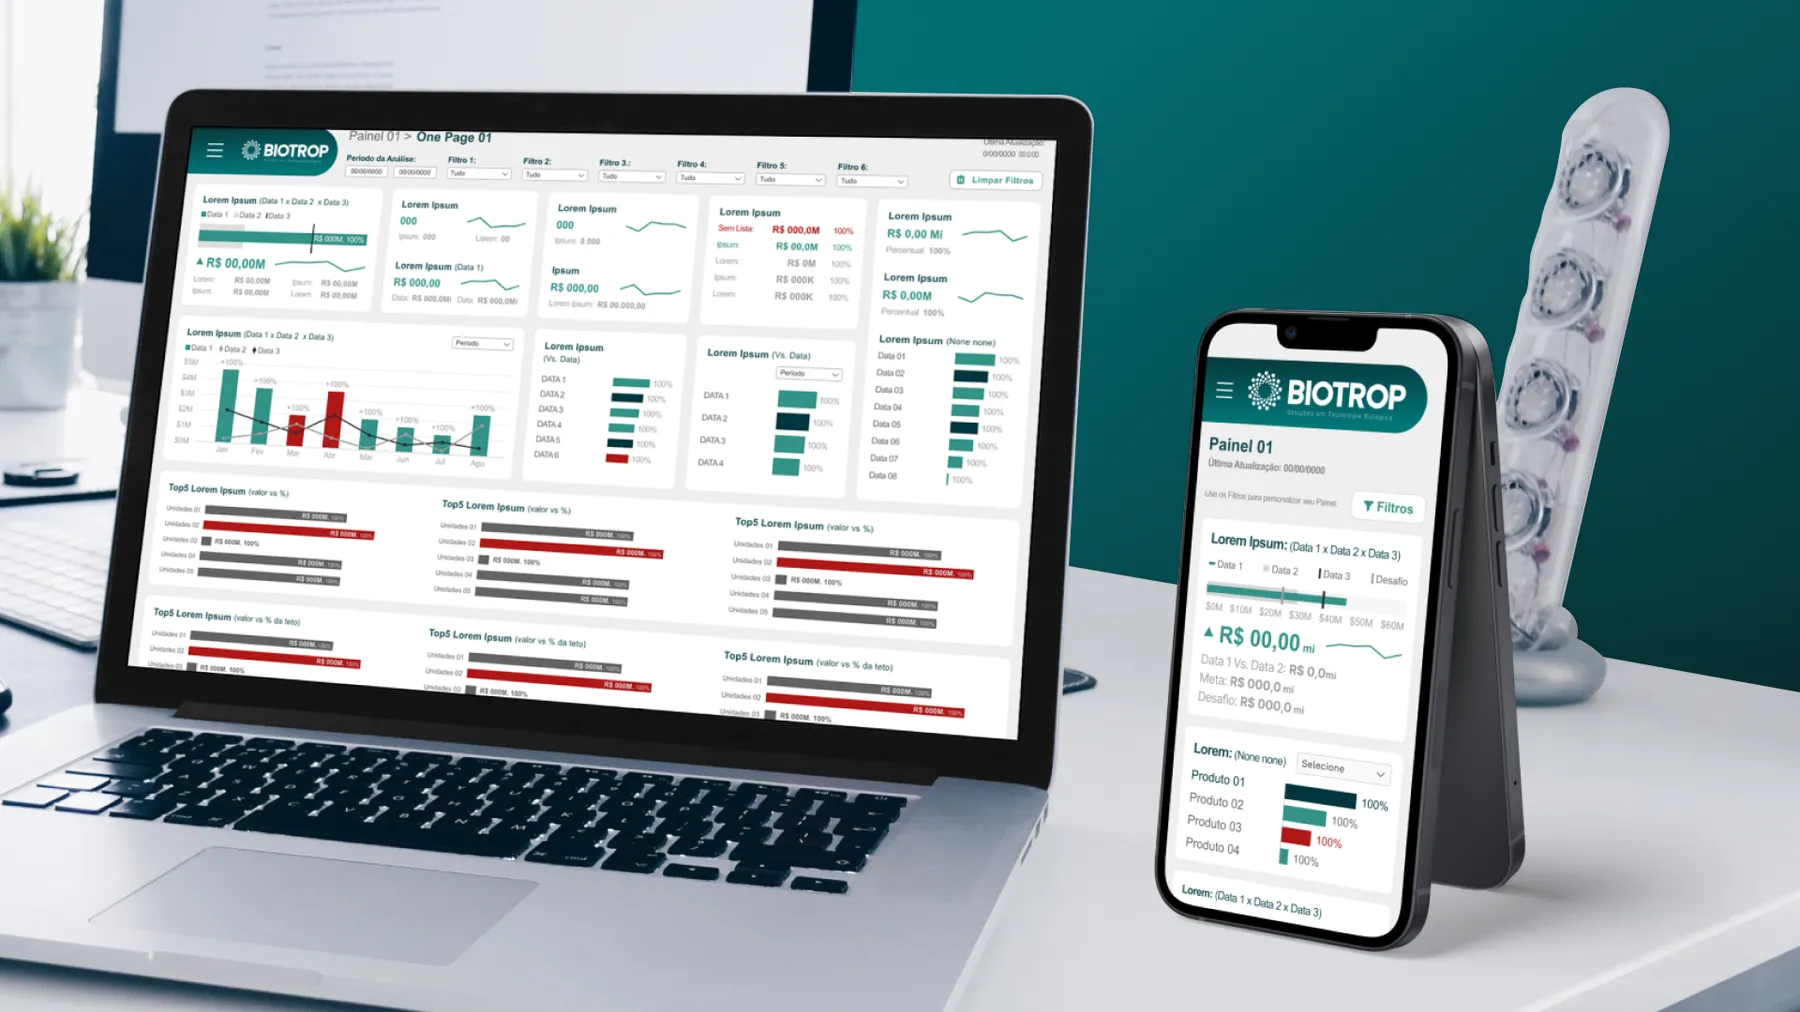
 agribusiness
Biotrop: dashboards that managers use instead of Excel
Dashboard redesign, Power BI themes and a course for the data team at an agricultural biologicals company.

 food and beverage
Danone Brasil: data design for dashboards people actually use
Light and dark Power BI themes, a best practices manual and a course for the data team.
contact.
bring the problem you have today.
Tell us what you need and we build the proposal from there.
- contact@olilodesign.com
- WhatsApp +55 11 97697-6224
- Av. Paulista, 1636, suite 1504, Cerqueira César, São Paulo, SP, 01310-200, Brazil