the context.
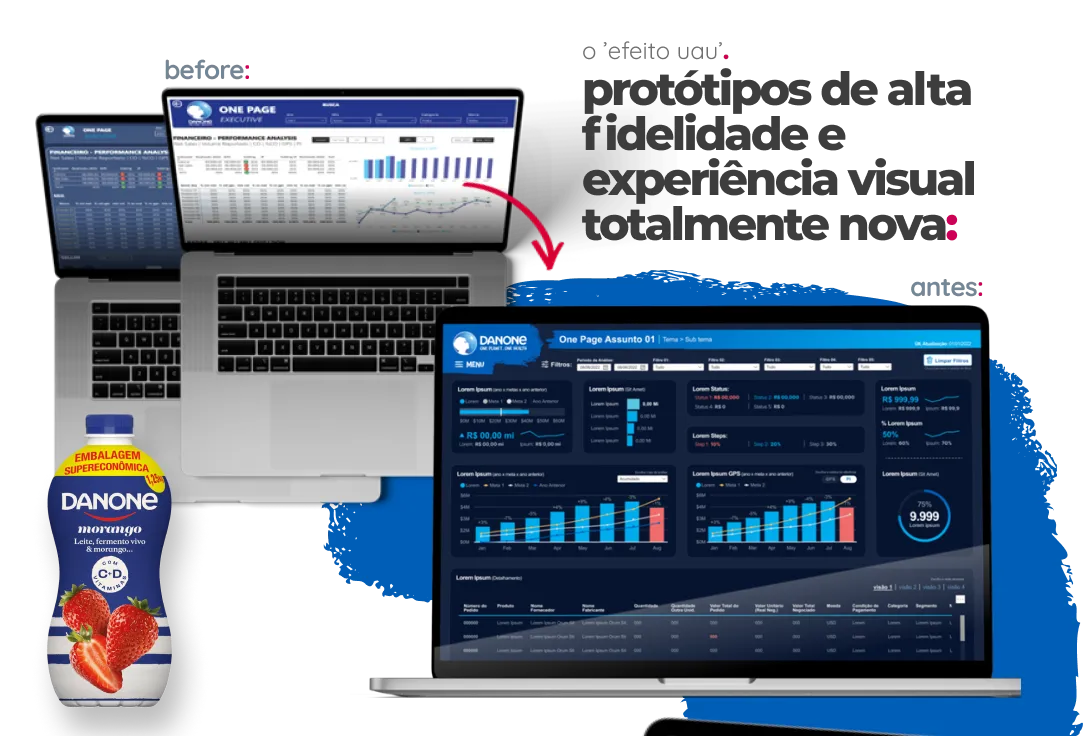
With more than a century in food and beverage, Danone Brasil had a common BI problem: unattractive dashboards that fell outside usability best practices, with low engagement from key users.
the challenge.
Revitalize the dashboards, improving look and organization, and give the data team a way to apply those improvements consistently at scale.
what we did.
- Brand analysis to create a data visual identity aligned with the company.
- High-fidelity prototypes.
- Custom Power BI themes, in light and dark versions.
- Best practices manual for consistent dashboards.
- Information Design and UX for Data course for the team.
the result.
- The data team started delivering clearer, more effective solutions.
- Users reported more involvement and satisfaction with the new BI tools.
“I had the pleasure of working with Olilo on building a pillar of data design best practices and storytelling. By training the team and defining more pleasant views, we delivered value to the business, generating valuable insights and speeding up decision-making. Olilo was responsible for developing UX solutions and guidelines that changed how we run projects.”
Rogério Domingues, Head of Data Analytics, Danone Brasil