
Dashboards have become decision tools inside companies. Even so, many end up underused or misread because nobody asked the user what they need to see. That’s where user research, or UX research, comes in.
what is UX research.
It’s the process of understanding the behavior, motivations and needs of the people who use a product, with methods such as interviews, usability tests, surveys and observation. In dashboards, research shows how users interact with the information, what they really need to see and what they do with that data afterwards.
real case: an executive sales analysis dashboard.
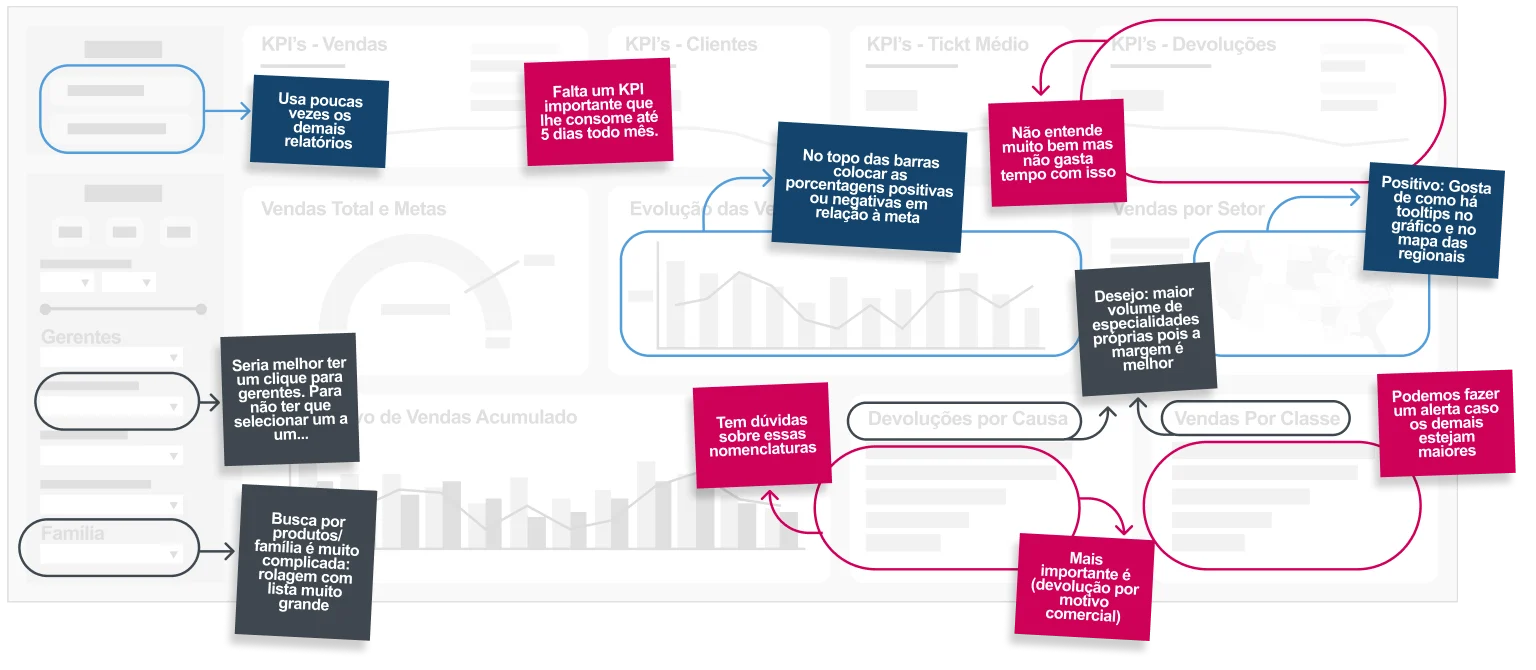
The user of this dashboard had trouble finding what he was looking for. During an in-depth interview, we drew his path over the screen.

He started at the filters, in the bottom left corner, and went up to the sales KPIs at the top of the page: a component used constantly, far from the main analysis. Then he looked at customers and average ticket, and split his attention between the sales map by sector and the cumulative comparisons, until he reached the rankings of returns and of sales by class.
Along the way, the returns KPI was ignored because the user didn’t understand what it showed. The sales evolution chart also went unanalyzed. The layout forced him to jump from one corner of the screen to another, and reading became tiring and fragmented.
the KPI that didn't exist and the email chain.
The most important finding: when a region was doing badly, the director wanted to know why, and the answer almost always depended on a metric that wasn’t on the screen. So he:
- emailed his secretary asking for updated information;
- the secretary wrote to each of the 10 managers;
- with the answers, she consolidated everything in Excel and ran the calculation;
- and pasted the result into the body of an email to the director.
The process took days. Only then could the director dig deeper into the diagnosis with the responsible manager, while the metric kept getting worse. A few hours of well-targeted research eliminated this waste.
restructuring and results.
what changed on the screen.
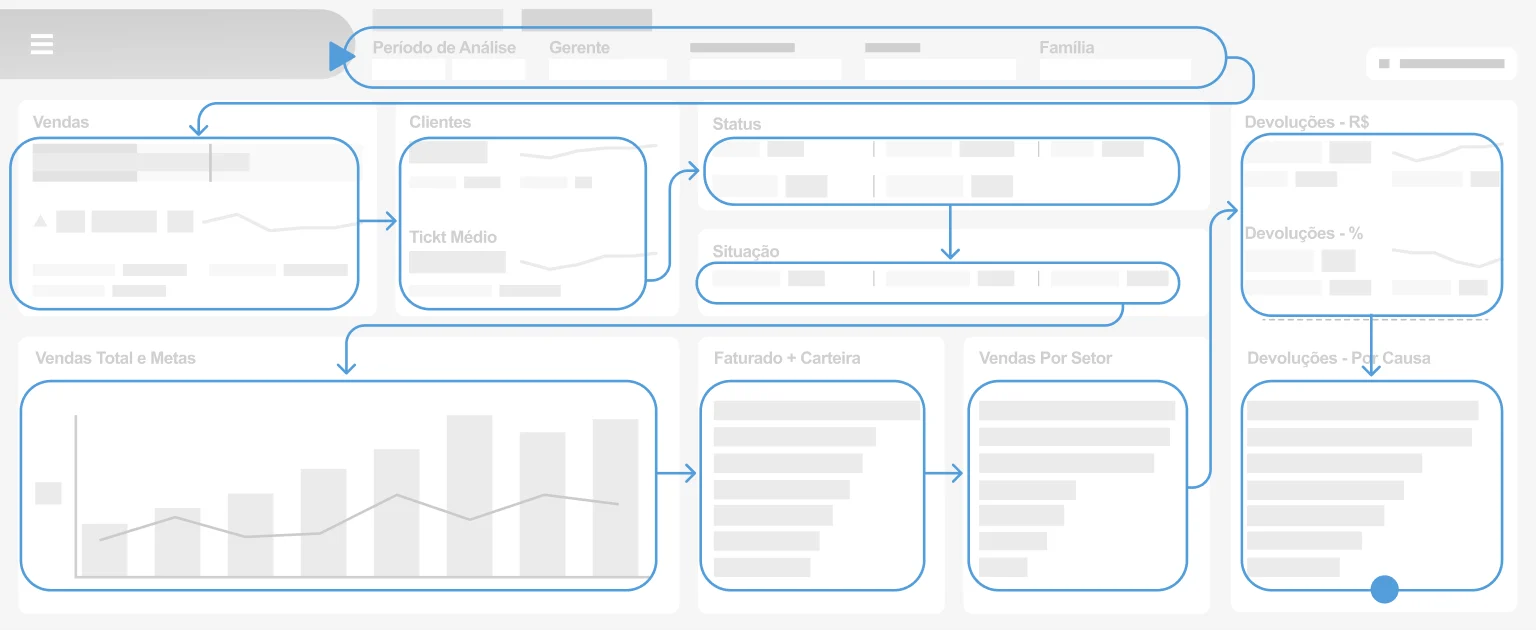
- Visual clarity. The information that matters most to the user got prominent positions, and the less-used items moved to a secondary view.
- Information architecture. Data now appears in layers of importance, in the order the user thinks.
- Suitable charts. Pies with many slices and dense bars gave way to visualizations that make quick comparison easy.
- Guidance text. Instructions like “select the metric” and the unit of each chart clear up doubts before they appear.
business impact.
- Alignment with the user. The research showed which data was essential, instead of “the more data, the better”.
- Less rework. Without research, dashboards usually need several rounds of adjustments after they’re finished.
- More productivity. With a clear interface, professionals spend less time searching for information.
- More satisfaction. A dashboard designed from the user’s point of view is used more often and with more confidence.
conclusion.
Investing in UX research when developing dashboards means building a tool that serves the people who decide. Users find a predictable environment, know where each answer is and decide with control in their hands.